Overview and Familiarization
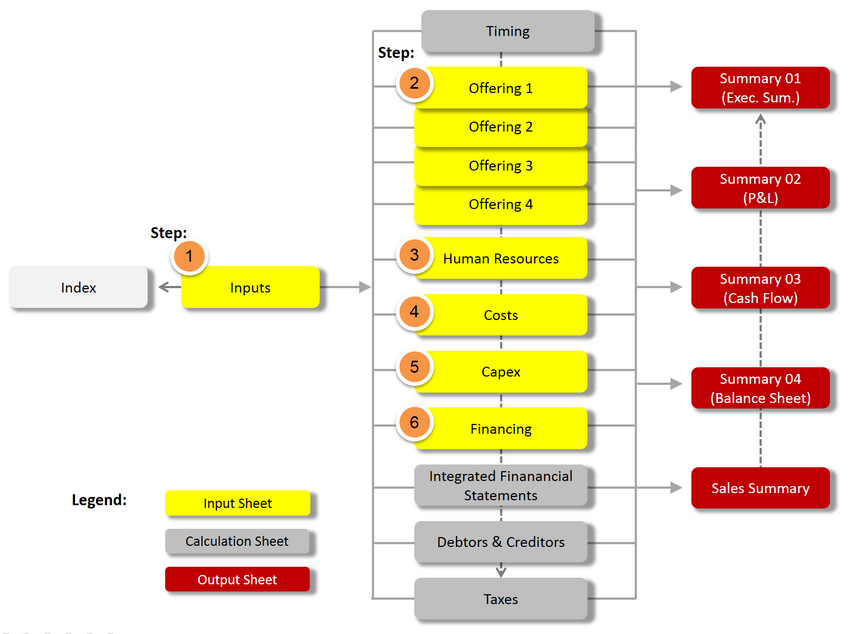
To become familiar with the general layout and structure of Excel-Financial-Model, have a look at the model flow chart and try adding or changing some of the supplied assumptions in the example model. Click the sheet tabs to navigate through the model’s input sheet and view the different calculation and output sheets.
For a better overview and quick navigation, the data in each worksheet is outlined (grouped). Outline symbols are on the left side of the worksheet. You can display different levels of data by using the mouse to click on the various symbols. To display rows for a level, click the appropriate outline symbol (one, two, three, etc.). We recommend starting by clicking “one”, which gives you a quick overview at the top level (everything collapsed). To expand or collapse specific data in your outline, click the plus and minus outline symbols.
The numbers outline the recommended order of planning steps in preparing a new model (see next chapter => Quick Start Guide).

